
In this review, we’ll see if the Data-Driven Design: Quantitative Research for UX course lives up to its promises and delivers a course worthy of your investment.
Diving into the world of User Experience (UX) design, it’s crystal clear that making choices based on solid data is the way to go. That’s exactly what the “Data-Driven Design: Quantitative Research for UX” course by the Interactive Design Foundation (IDF) is here for. It skillfully blends traditional UX design methods with the critical need for quantitative analysis. This approach helps uncover deep insights into user behaviors and preferences.
In this review, we’re going to take a closer look at this course. We’ll explore the content it offers, how it’s structured, and the overall value it brings to the table. Whether you’re just starting your journey in UX or you’re a seasoned professional, there’s something in here for everyone.
The journey through this course kicks off by laying down the essential principles of quantitative research. It’s all about giving you a sturdy platform of knowledge to start from. As the course unfolds, it dives into more intricate subjects like statistical analysis and how to make sense of user data, all with the goal of refining your design skills.
William Hudson, the guide on this adventure, comes packed with a ton of experience in interactive systems. He’s here to share not just theories but real, actionable insights that you can apply to your work.
In this review, I’m going to walk you through everything step by step. We’ll look at what the course aims to teach, break down the costs, and dissect the content and structure. Plus, I’ll throw in my two cents about what parts really hit the mark and which ones didn’t quite live up to the hype. Wrapping it all up, I’ll give you the lowdown on whether this course is worth the investment and how it can fit into your UX design arsenal.
In this review, you’ll learn:
- What does this course promise?
- How much does Data-Driven Design: Quantitative Research for UX course cost?
- What’s included in the Data-Driven Design: Quantitative Research for UX course?
- Structure of the class
- Key things I learned after taking the course
- Things I liked and didn’t like about the Data-Driven Design: Quantitative Research for UX
- Is Data-Driven Design: Quantitative Research for UX course worth the money?
What does this IDF course promise?

The “Data-Driven Design: Quantitative Research for UX” course from IDF really sets the stage for an immersive learning experience. It’s not just about wandering through the theory of quantitative research in UX design; it’s more like a hands-on adventure. This course is crafted to arm you with the tools and knowledge to apply statistical methods and data analysis to tackle actual design puzzles you might face out there in the wild.
At its core, the course aims to equip learners with the skills to:
Understand the Role of Data in UX Design
It begins with the fundamental premise that data, particularly quantitative data, is pivotal in making informed design decisions. The course promises to unravel the complexities of data interpretation and its application in enhancing user experiences.
Master Quantitative Research Techniques
From basic statistical concepts to advanced data analysis tools, the course covers a wide array of methodologies. It promises to transform learners from novices to proficient users of quantitative research methods.
Apply Learning in Practical Scenarios
The course is structured around actionable knowledge. It pledges to provide learners with not just the ‘what’ but the ‘how’ of applying data-driven strategies to design projects, ensuring a tangible impact on their professional practice.
Build a Strong Portfolio
With a focus on real-world applications, the course offers projects that not only reinforce learning but also serve as robust portfolio pieces, showcasing the learner’s ability to integrate quantitative research into UX design.
—
Fundamentally, this course is designed to revolutionize your educational experience. It transcends the conventional approach by integrating theory with practical exercises and opportunities for professional growth. For those eager to explore the impact of data on design decisions, this course stands out as an exciting opportunity.
How much does Data-Driven Design: Quantitative Research for UX course cost?
Investing in professional development is a significant consideration for many, and the cost of the “Data-Driven Design: Quantitative Research for UX” course is an essential aspect to evaluate. The course is priced to reflect the comprehensive, in-depth learning experience it offers, aiming to strike a balance between affordability and the value provided.
Generally, the course itself doesn’t come with a price because IDF operates on a membership model. Once you pay for your membership, you gain access to all the courses.

- Student Membership: Priced at $15 per month, billed annually, tailored for students worldwide, making design education accessible.
- Professional Membership: Available at $22 per month, billed annually, providing comprehensive access to IDF’s resources for design practitioners.
- Design League Membership: Premium membership at $240 per month, offering intensive learning and personal coaching for those committed to advancing their design careers.
For the course in question, those fees cover:
- Access to Expert-Led Content: Learners gain access to meticulously crafted modules led by William Hudson, an expert in UX and interactive systems. His insights and practical advice form the backbone of the course content.
- Hands-On Projects: Beyond theoretical knowledge, the course fee includes the opportunity to work on real-life projects that enhance learning and can be added to your professional portfolio.
- Community and Networking: Enrollment in the course also grants access to IDF’s community of design professionals and enthusiasts. This network can be invaluable for peer support, feedback, and making professional connections.
- Ongoing Resources: The course promises not just a one-time learning sprint but ongoing access to resources and updates in the field of quantitative UX research.
For those committed to advancing their UX design capabilities through data-driven methodologies, this course represents a strategic investment in their professional future.
What’s included in the Data-Driven Design: Quantitative Research for UX course?
Practical information:

The “Data-Driven Design: Quantitative Research for UX” course offers a rich tapestry of learning materials, tools, and community features designed to provide a holistic educational experience.
Here’s a breakdown of what enrollees can expect:
- Comprehensive Learning Modules: The course is structured into detailed modules that cover everything from the basics of quantitative research to advanced data analysis techniques. Each module is designed to build on the previous one, ensuring a smooth learning curve.
- Interactive Assignments: To reinforce learning, the course includes interactive assignments that challenge students to apply what they’ve learned in practical scenarios. These assignments are critical for transitioning from theoretical knowledge to practical skills.
- Expert Feedback: One of the key benefits of this course is the opportunity to receive feedback from industry experts. This feedback is invaluable for understanding complex concepts and improving your approach to UX design.
- Community Access: Enrollment grants access to IDF’s global community of design professionals. This community is a platform for discussion, collaboration, and networking, offering a space to share experiences and learn from peers.
- Lifetime Access to Course Materials: Unlike some courses that limit access to materials post-completion, IDF provides lifetime access to this course’s content. This allows learners to revisit and refresh their knowledge as needed.
- Certificate of Completion: Upon successfully completing the course, learners receive a certificate that acknowledges their achievement and can be added to their professional credentials.
What you’ll be learning:
- What is quantitative research and how it differs from qualitative
- Why quantitative research is important
- Alternatives to quantitative methods
- Simple statistical analysis
- Quantitative methods in detail: surveys, early-design testing, web/app analytics and A/B testing
- Participant recruitment and screening
In essence, the course is designed not just to impart knowledge but to provide a comprehensive ecosystem for learning, application, and professional growth. This inclusivity ensures that learners have all the tools and support they need to succeed in integrating quantitative research into their UX design practices.
Structure of the course
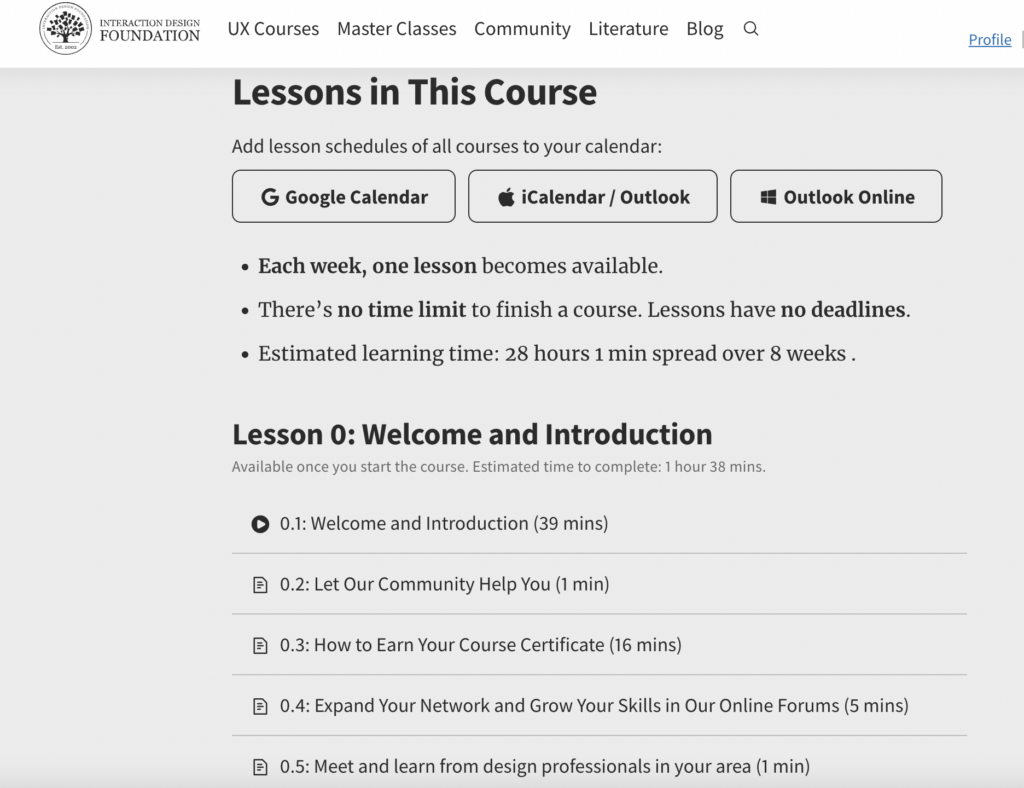
The course is divided up into 87 lessons and distributed into 7 sections:
- Why Design with Data?
- Statistics
- Surveys
- Early-Design Testing
- Web and App Analytics
- A/B and Multivariate Testing
- Course Certificate, Final Networking, and Course Wrap-up
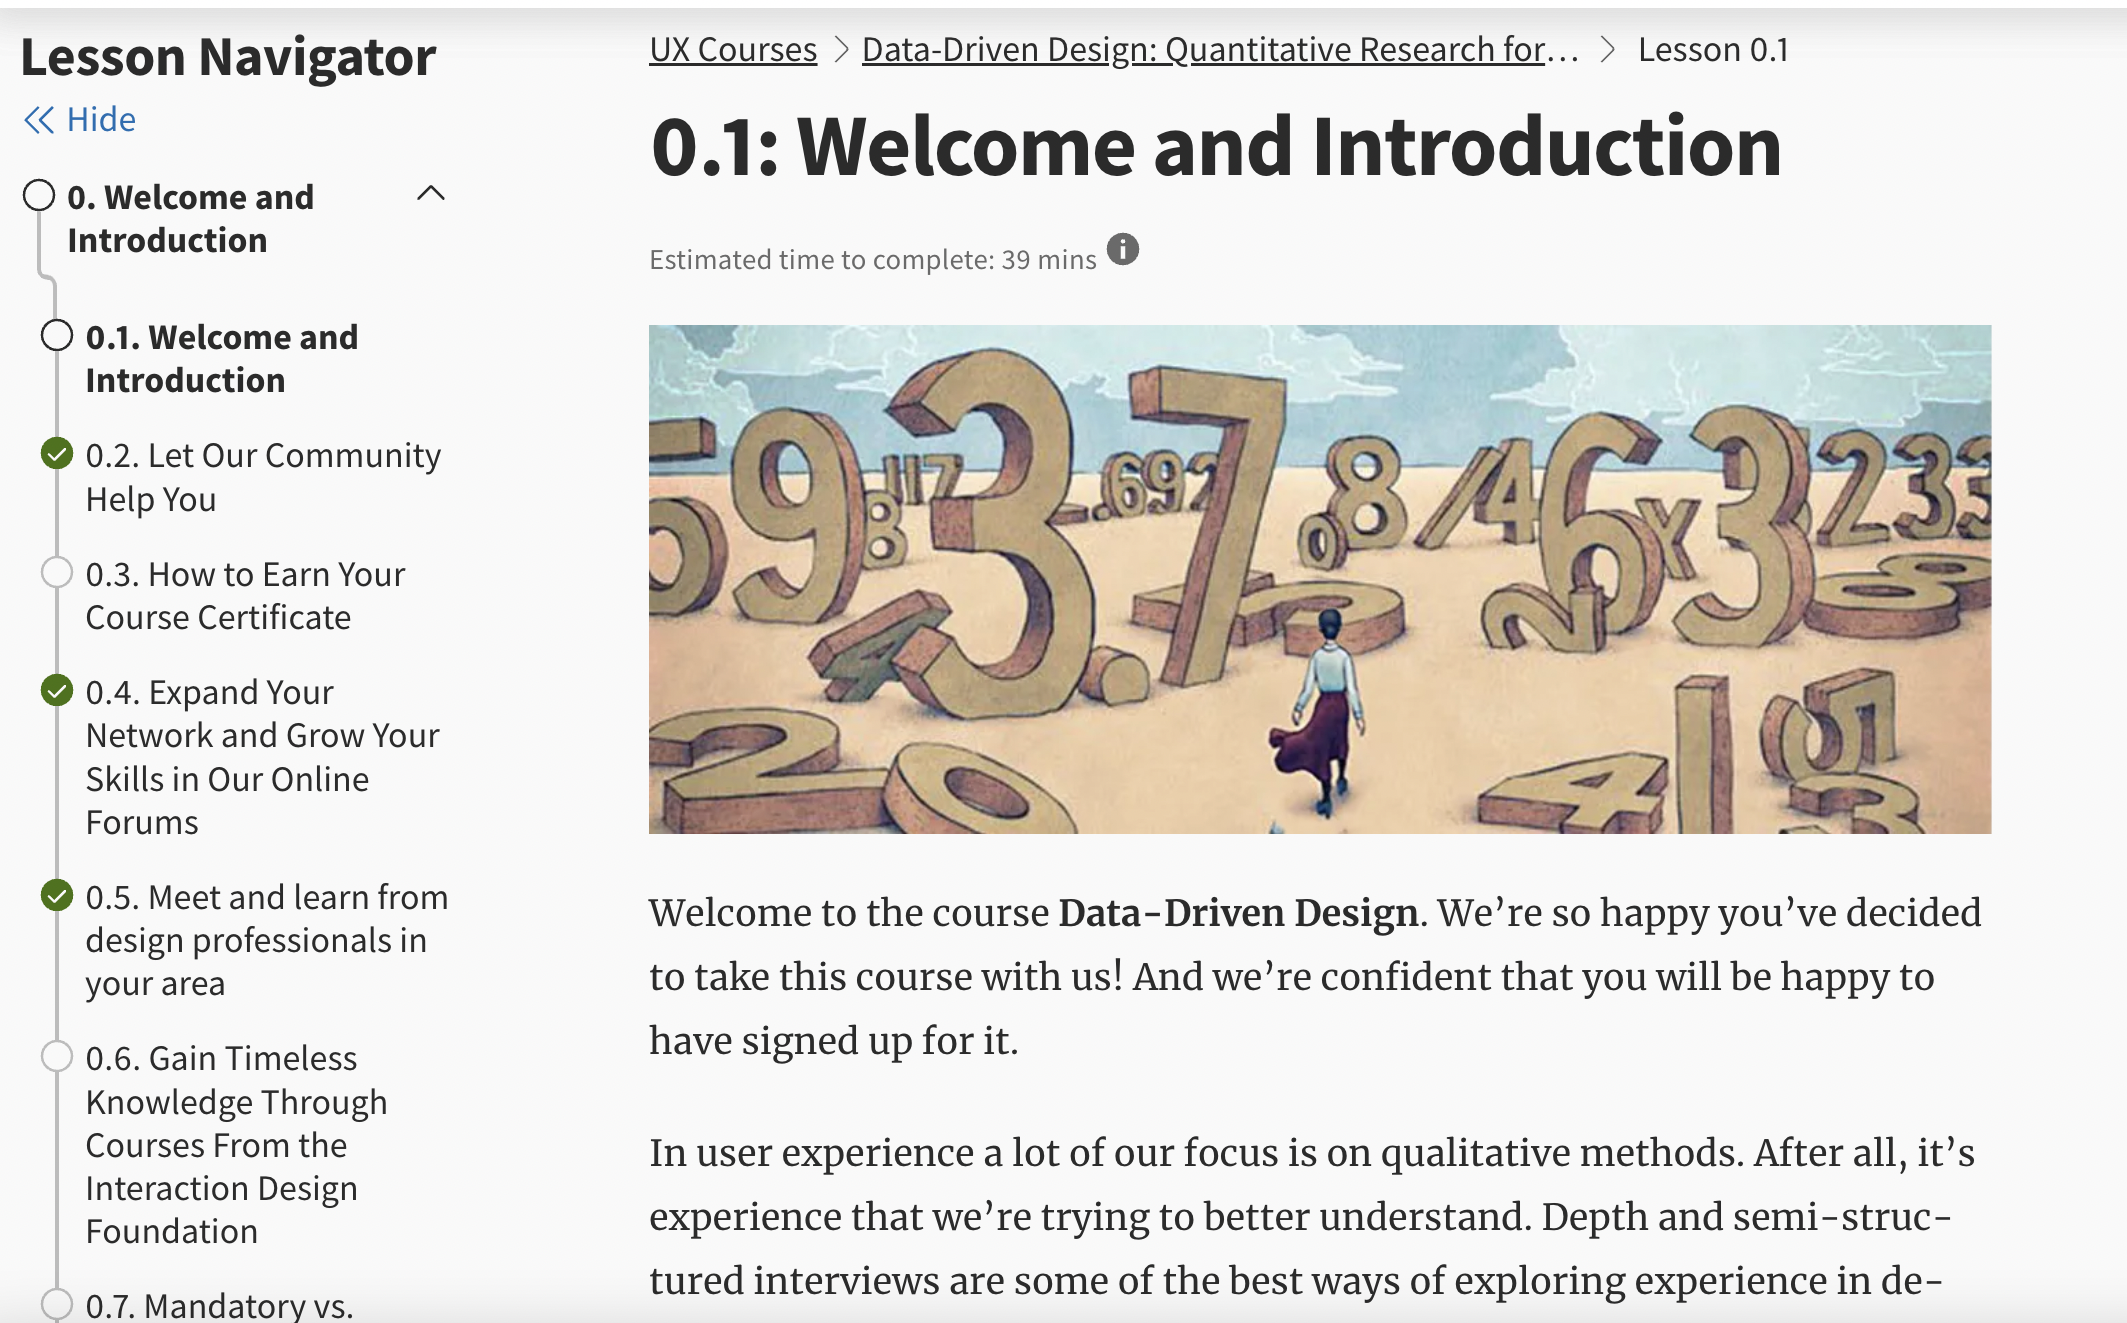
One thing that really caught my attention in this course structure is how William Hudson, the instructor, incorporates both written notes and videos. Sometimes he even combines the two, and what’s really convenient is that he provides full transcripts for all the videos. This approach makes learning accessible and convenient for everyone.
The “Data-Driven Design: Quantitative Research for UX” course is meticulously structured to facilitate a comprehensive understanding of quantitative research methods in the context of UX design. This structure is aimed at ensuring learners not only grasp the theoretical aspects but also gain hands-on experience applying these concepts. Here’s an overview of the course’s structure:
- Introduction to Quantitative Research: The course begins with an introductory section that sets the stage for the importance of quantitative research in UX design, outlining the key concepts and methodologies that will be covered.
- Fundamentals of Statistics: Before diving deep into data analysis, the course covers the basics of statistics. This foundation is crucial for understanding the later, more complex analyses.
- Data Collection Methods: Learners are introduced to various methods of collecting quantitative data, including surveys, A/B testing, and analytics. This section also covers how to design effective data collection instruments.
- Analyzing and Interpreting Data: With data in hand, the course then moves on to teach how to analyze this data. This includes instruction on using software tools for data analysis, as well as how to interpret the results in a UX context.
- Applying Data to Design Decisions: Perhaps the most critical section, this part of the course focuses on how to use the insights gained from data analysis to inform design decisions. It includes case studies and examples to illustrate this process.
- Projects and Portfolio Building: To ensure that learners can apply what they’ve learned, the course includes project work that simulates real-world UX design challenges. These projects not only reinforce learning but also contribute to a portfolio that showcases the learner’s skills.
Community Engagement and Networking: The course structure also emphasizes the importance of engagement with the broader UX and design community. It encourages participation in forums, discussions, and networking events organized by IDF

Key things I learned after taking the course
After completing the “Data-Driven Design: Quantitative Research for UX” course, the depth and breadth of knowledge gained are substantial. Here are some of the key takeaways and lessons I learned from the course:
The Power of Data in UX Design
One of the most significant realizations is the transformative power of quantitative data in making informed UX design decisions. The course illuminates how data can uncover user behaviors, preferences, and pain points that might not be evident through qualitative research alone.
Statistical Analysis is Accessible
Initially, the prospect of statistical analysis can seem daunting. However, the course demystifies statistics, providing clear, understandable explanations and practical applications that make these concepts accessible to designers without a background in data science.
Effective Data Collection Techniques
Learning about the various methods for collecting quantitative data, from surveys to analytics tools, and how to design these methods to yield the most useful data, has been invaluable. The course emphasizes the importance of asking the right questions to gather meaningful data.
Interpreting Data to Inform Design
Perhaps the most crucial skill gained is the ability to analyze and interpret data to make evidence-based design decisions. The course teaches not just how to collect and analyze data, but how to draw actionable insights from it.
Real-World Application
The practical projects included in the course are instrumental in applying theoretical knowledge to real-world UX challenges. These projects help bridge the gap between learning and doing, reinforcing the course content and showcasing how to use data to drive design improvements.
Community and Networking
Engaging with the IDF community has provided a platform for discussion, feedback, and learning from the experiences of other design professionals. This community aspect enriches the learning experience and expands professional networks.
—
I’ve found these key learnings to be incredibly valuable, not only deepening my grasp of quantitative research in UX but also equipping me with practical tools and techniques that I can directly apply in my professional projects. This course has truly played a pivotal role in shaping my approach to UX design, making it more data-driven and effective.
Things I liked and didn’t like about the Data-Driven Design: Quantitative Research for UX course
Looking back on the “Data-Driven Design: Quantitative Research for UX” course, there’s definitely a lot to appreciate, as well as a few areas that could be improved. Here’s a balanced overview of what stood out to me, starting with the positives:
Comprehensive Coverage
The course really shines in its thorough examination of quantitative research methods. It covers both the basics and more advanced techniques, ensuring a deep understanding. What’s particularly impressive is how it balances theory with practical application, making the learning experience both enriching and practical.
Expert Instruction
The insights and guidance provided by William Hudson are invaluable. His expertise and practical examples bring clarity to complex topics, making them accessible to learners of various backgrounds.
Interactive Learning Experience
The interactive assignments and projects are definitely a highlight of the course. They provide hands-on experience that’s both challenging and rewarding, making learning enjoyable. Plus, these activities aren’t just about reinforcing what you’ve learned; they also play a significant role in building up your portfolio, which is a major plus.
Lifetime Access
One major advantage of the course is having lifetime access to the materials. This means you can revisit the content whenever you need to refresh your understanding of concepts.
Areas for Improvement:
Pacing and Structure
Although the course is comprehensive, I believe that certain sections could be presented in a more streamlined manner to better maintain engagement and manage cognitive load. This is particularly important in the denser statistical segments, where simplifying the presentation could enhance understanding and retention for learners.
More Case Studies
Incorporating additional real-world case studies could enhance the learning experience, providing clearer insights into how quantitative research directly impacts UX design decisions in various industries.
Technical Tool Training
While the course does cover the use of tools for data analysis, diving deeper into these tools, including exploring their more advanced features, could better equip learners to handle complex data analysis tasks.
—
Overall, the strengths of the course far outweigh its shortcomings. The minor areas for improvement do not detract from the course’s substantial value in equipping learners with the skills to adopt a data-driven approach to UX design.
Is Data-Driven Design: Quantitative Research for UX worth the money?
When weighing the investment in the “Data-Driven Design: Quantitative Research for UX” course, it’s crucial to assess the return in terms of knowledge acquired, skills honed, and the potential impact on one’s professional path. With its thorough exploration of quantitative research principles, hands-on application via assignments and projects, expert guidance, and community involvement, the course provides significant value.
Investment in Professional Growth
Purchasing the course represents an investment in professional growth, offering learners an extensive exploration of the quantitative facets of UX design—a skill set that’s in high demand. The insights and proficiency gathered through this course lay the groundwork for making informed, data-driven design choices, thereby elevating the caliber of UX projects.
Practical Application and Portfolio Building
The hands-on projects not only reinforce learning but also produce tangible results that can be exhibited in a professional portfolio. This feature is especially beneficial as it offers concrete proof of the capability to apply quantitative research methods in real-world UX contexts.
Networking and Lifelong Learning
Access to a community of peers and industry professionals enhances the course’s value, providing continuous opportunities for learning, collaboration, and professional advancement. Lifetime access to course materials ensures learners can continually refresh and update their knowledge to keep pace with evolving industry trends.
Conclusion:
Considering the depth of content, the practical skills developed, the quality of instruction, and the additional benefits of community and lifelong access, the “Data-Driven Design: Quantitative Research for UX” course is indeed worth the investment for those serious about advancing their UX design capabilities through a data-driven approach. It’s an investment not just in learning a new set of skills but in significantly enhancing one’s approach to UX design and problem-solving.
In summary, for professionals and enthusiasts looking to integrate quantitative research into their UX practice, this course stands out as a valuable resource, offering tools and insights that are likely to have a lasting impact on their work.